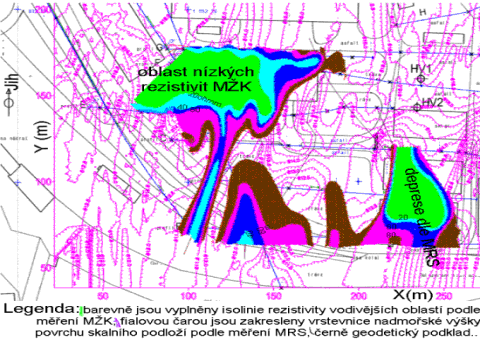
(locality of a painting factory with ecological problem of the dissolving agent leak)
We can see the typical results of measuring by methods of MK , dipole resistivity profiling (DP) and shallow refraction seismics on this 2D geophysical map. There were areas of reservoir of contaminated water and tectonic lines mapped according to low resistivity zones by MK and DP (coloured isolines on the picture right). The relief of the surface of rock subbase was as well mapped by shallow refraction seismics (violet isolines on the picture). Its depressions are in accordance with axis of tectonic lines and with places of contaminated water reservoirs.
Anomalies were verified by drilling later.
(abbreviated, simplified)